Income Inequality in US
Prabhakar, Ted, Apekshit
Here we need to explain the idea of the project. If you would like to learn more please contact
This project will provide an easy to use series of visualizations that allow informed users to explore different aspects of income inequality.
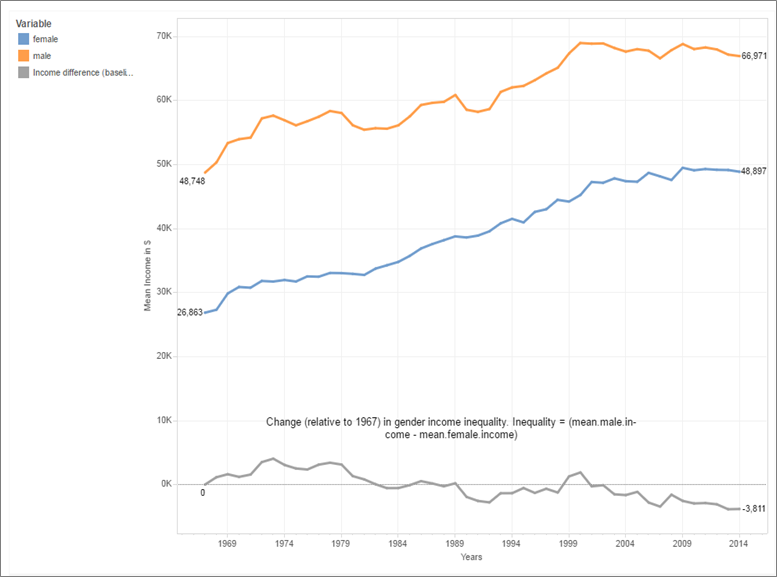
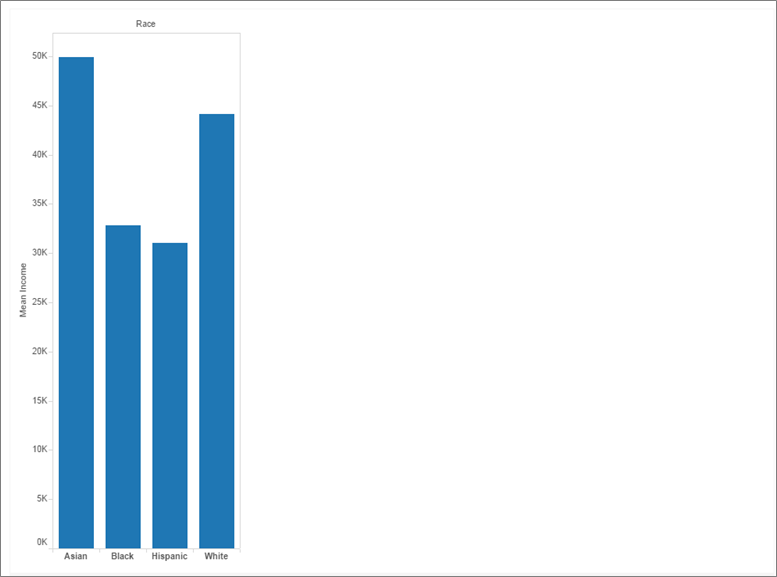
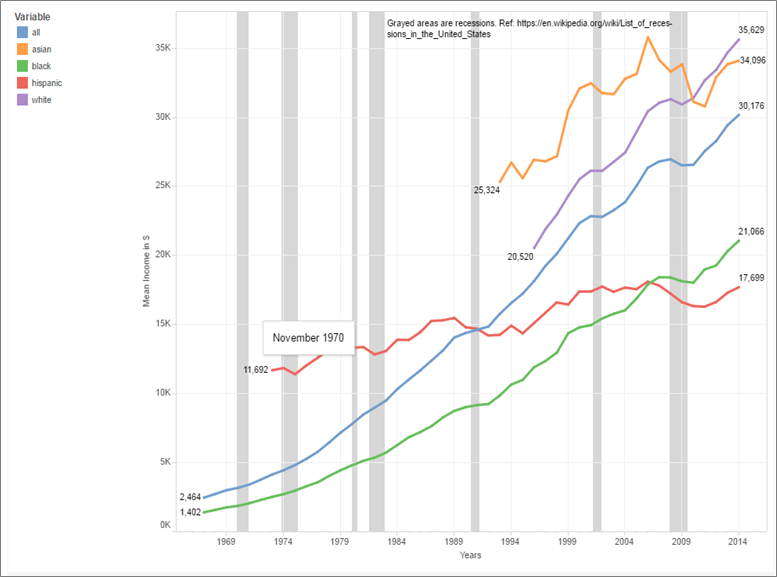
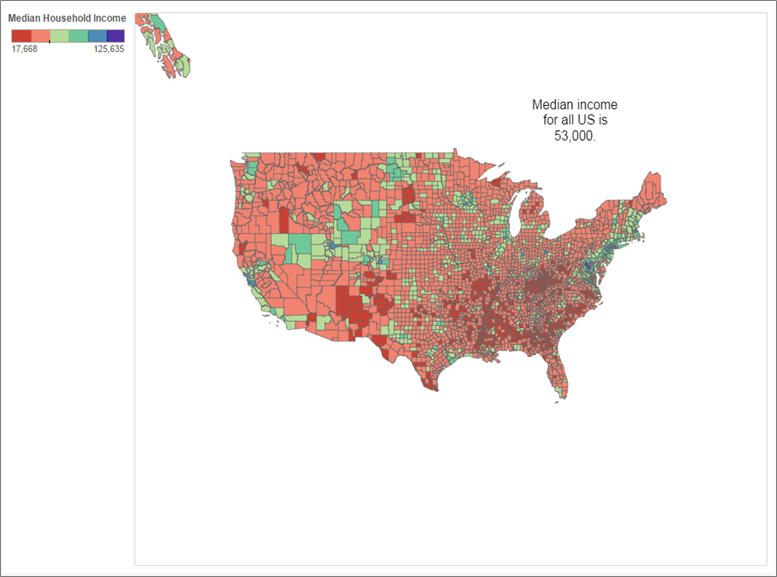
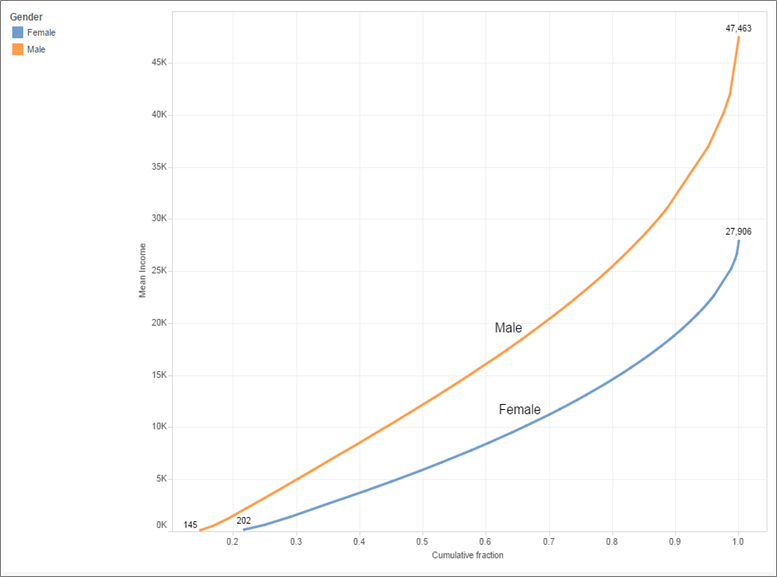
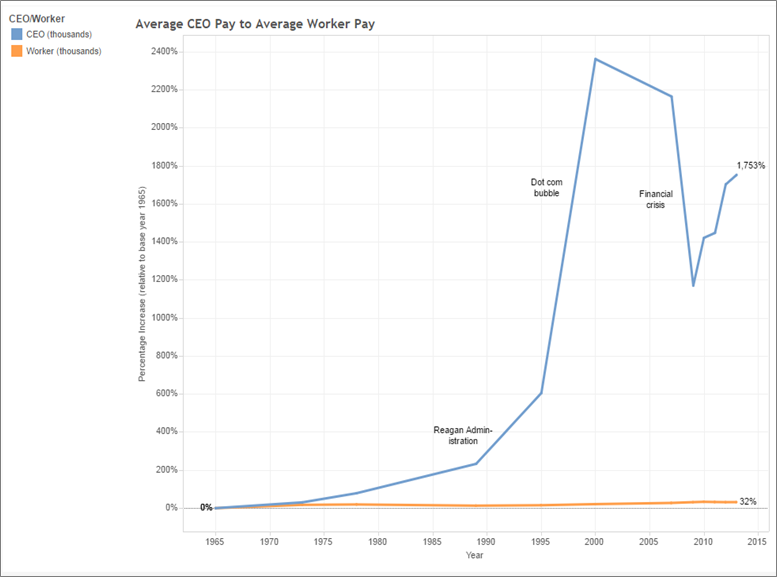
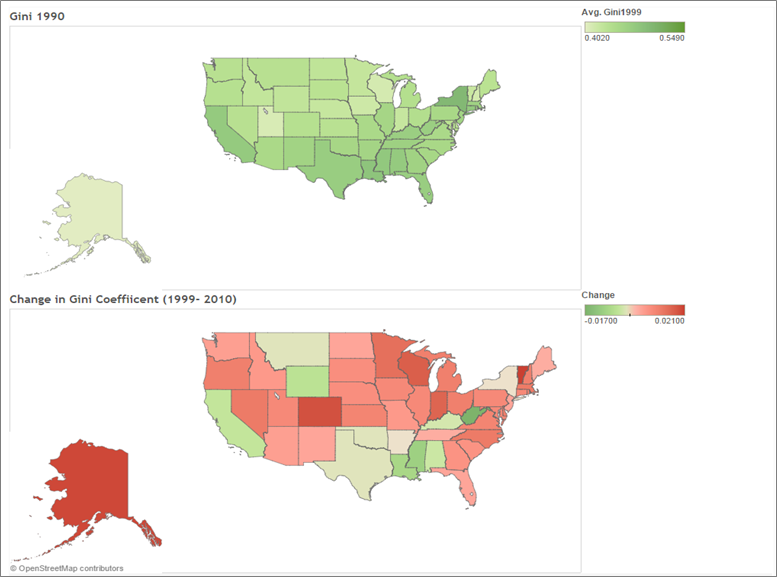
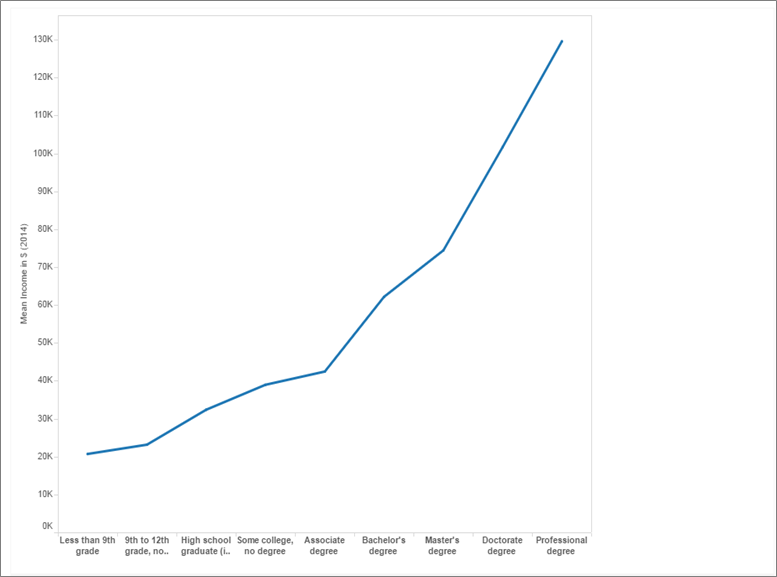
We want users to explore income inequality across the United States and across different factors, such as gender or geography. The point is to create a single repository of various income inequality data for reference.
The data for the project is taken from the
We are from MIDS team


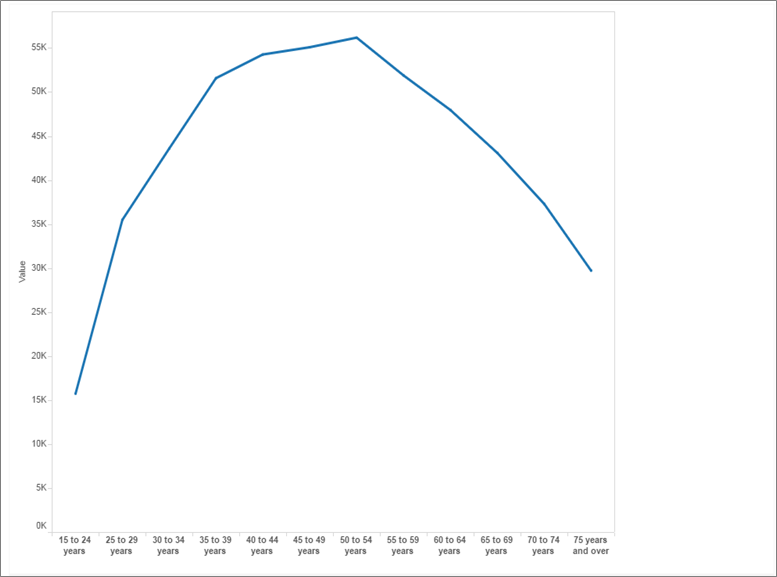
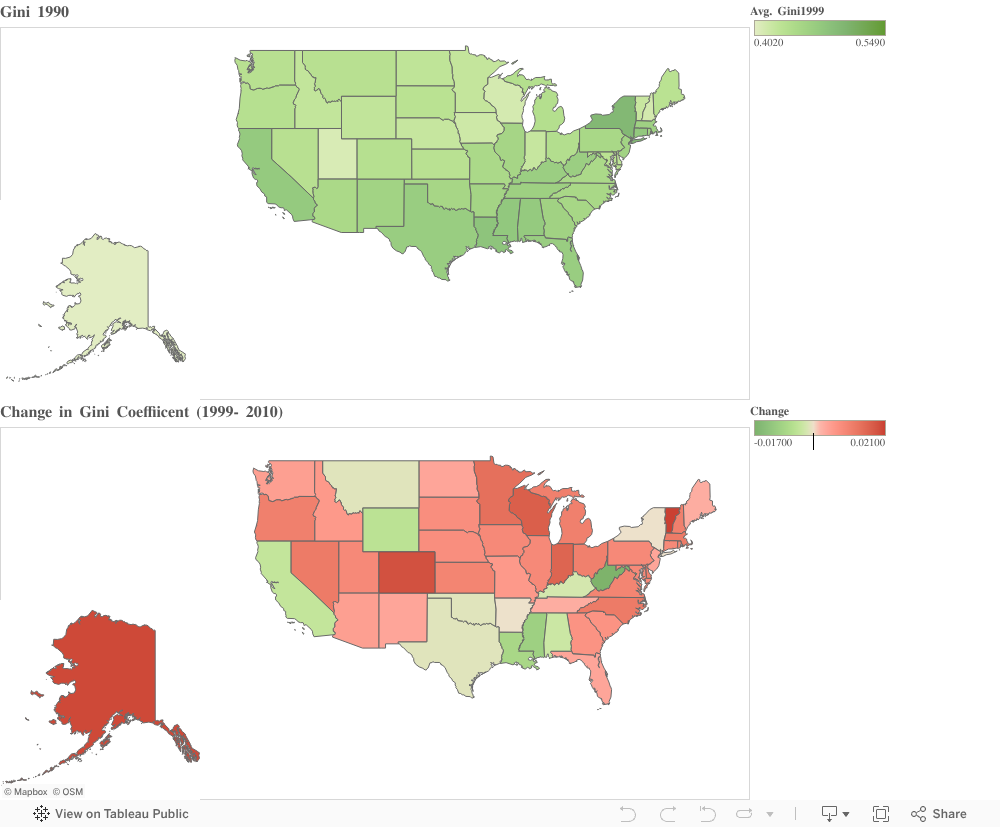
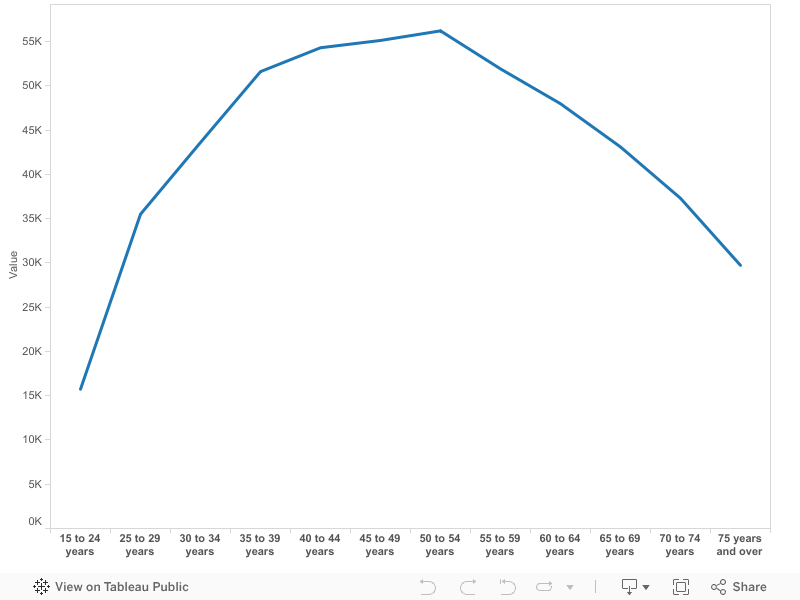
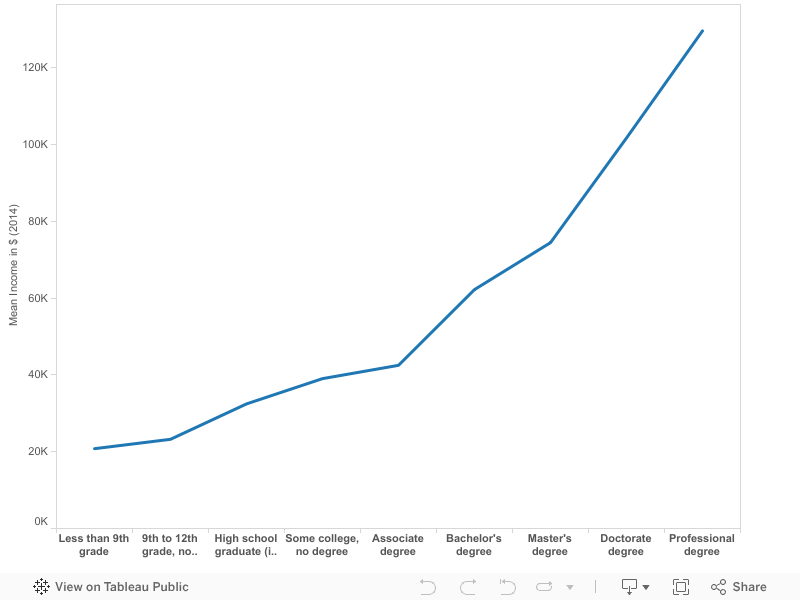
Here are various dimensions of Income Inequality in United States
Click on any of the below visualizations to explore in detail
If you have any questions, please contact Prabhakar (prabhakar@berkeley.edu), Ted (glenn.dunmire.iv@gmail.com), Appy (apeksharma@berkeley.edu).
We used website template available at Start Bootstrap